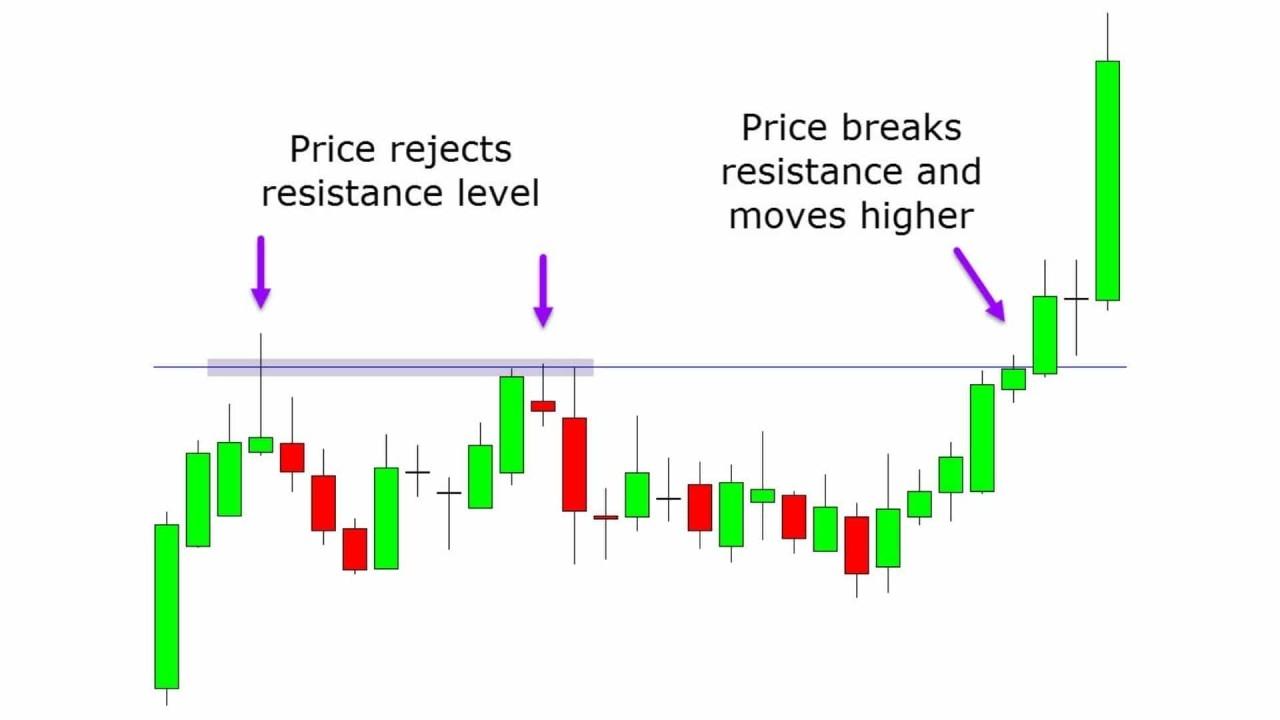
One of the most popular trading strategies, often used with the best chart patterns, to capture price momentum is by trading breakouts. A breakout simply refers to the concept where the price of an asset crosses over a defined support or resistance level that suggests the continuation or reversal of the trend. Although breakouts can be very profitable, false breakouts when the price moves temporarily beyond a level only to come back in again are of natural occurrence, thus leading to losses. As shown in this lesson, we demonstrate to you how to trade successful breakouts successfully avoiding your traps from those false signals.
Understanding Breakouts and What Drives Their Significance
A breakout represents a clear penetration of a critical level by price action, often initiated by the increase of volume bought or sold. This break more often would imply that the market sentiment is now different, and the breaking momentum is used for traders entering a trade in the breakout direction. For example, if it breaks above resistance during an uptrend, then it may become clear that the buyers are indeed in control, and prices will extend higher. Conversely, in a downtrend, if it breaks below support, it indicates that there is greater selling pressure.
Price Consolidation Before Breakout: A breakout becomes much more effective if it is accompanied by consolidation. During the consolidation period, the price movement is narrow and the amount of volatility decreases. During such phases, there occurs formation of patterns like triangles and flags, which indicate that such shares may break out anytime. The longer and tighter the consolidation period, then the more likely a powerful breakout. A tight consolidation tends to mean that buyers and sellers cannot seem to make up their minds, and a breakout out of this consolidation tends to have more momentum as it is clearing an established range. Confirmation Indicators: Adding to the confirmation, are the use of indicators like moving averages, RSI, or Bollinger Bands. For example, if the RSI breaks out of a concurrent overbought or oversold zone, then the breakout is even more confirmed.
Trading Breakouts with the Best Chart Patterns
The best of chart patterns for breakouts include triangles, head and shoulders, flags, and cup and handle. Here is how to approach each one of them:
1. Triangles (Ascending, Descending, and Symmetrical)
Triangles are continuation patterns where prices consolidate inside a contracting range. Trading Strategy For ascending triangles, wait for a breakout above the resistance line coupled with volume to validate the move. In descending triangles, breakdowns below the support line that are coupled with high volume confirm a bearish move. With symmetrical triangles, wait for a clear breakout in either direction and is supported by a volume surge.
Avoiding False Breakouts: A breakout that occurs on low volume should be anticipated to be confirmed with a retest of the breakout level before entry. If price returns to that level and can hold it, the credibility of the breakout is enhanced.
2. Inverse Head and Shoulders
The head and shoulders pattern is pretty much the most common reversal pattern. A head and shoulders top hints at a possible bearish reversal, whereas an inverted head and shoulders hints at a bullish reversal.
Trading Strategy: For a head and shoulders pattern, wait for the price to break down below the neckline with a significant surge in volume that confirms this reversal. For an inverted head and shoulders, look for a breakout above the neckline on high volume.
False Breakouts: There is an advantage in waiting for the price to go down and retest the neckline with low volume when there is a breakout. The retest would make sure that the breakout is legitimate and avoids entry on weaker signals.
3. Flags and Pennants
Flags and pennants are continuation patterns that typically take place following significant price movements. They indicate that the market is taking a breather for a while before continuing in the same direction.
Trade Strategy: In case of a reversal or continuation, confirmation occurs when the price breaks through the resistance of the flag or pennant in an uptrend on high volume and breaks down below the support of the flag or pennant on high volume in a downtrend.
False Breakout: If the breakout is on low volume, wait for another confirmation like retest or close above the breakout level. Such confirmation carries very few chances of catching a false breakout.
Further Advice on Trading Breakouts
Be smart when using stop-loss orders: Use stop-loss orders at intelligent levels for the pattern, such as placing them just below the level of support for a bullish breakout or above the level of resistance for a bearish breakout. This reduces possible losses in case of a false breakout.
Conclusion
Breakout trading with superior chart formations can be the best breakout trade ever when done perfectly. Enormous volumes coupled with proper consolidation in price actions, confirmation tools like moving averages or RSI will make up for a good breakout trade. If all these confirmations are met before the traders will enter into the trades and do not trade during low-volume breakouts, they have a better shot at hitting it big time and reducing false breakouts. A combination of additional strategies such as stop-loss orders, realistic targets, and keeping abreast of general market conditions will further enhance breakout results.

